Split and plot NextClade mutations
Using the Gisaid entries: EPI_ISL_3152653, EPI_ISL_3426926, EPI_ISL_3229925, EPI_ISL_3260666, EPI_ISL_3426910 and running them through the NextClade web interface and downloading the results as a .csv file.
library(tidyverse)
# Nextclade
nextclade <- read_delim("nextclade.csv",
";", escape_double = FALSE, trim_ws = TRUE)
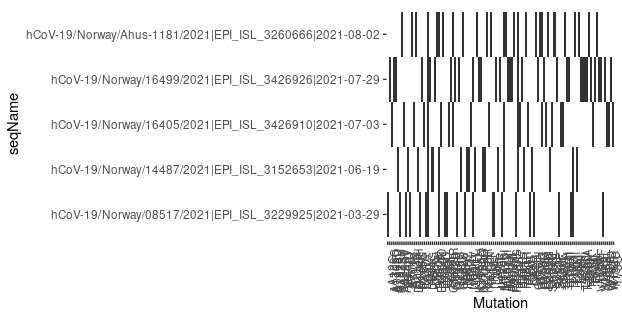
# Plot all samples and all aa Substitutions
nextclade %>%
select(seqName, aaSubstitutions) %>%
# Remove samples with no sequence (if any)
drop_na() %>%
mutate(tmp = str_split(aaSubstitutions, ",")) %>%
unnest(tmp) %>%
separate(tmp, into = c("Gene", "Mutation")) %>%
select(-aaSubstitutions) %>%
ggplot(aes(x = Mutation, y = seqName)) +
geom_tile() +
theme(axis.text.x = element_text(angle = 90),
panel.background = element_blank())
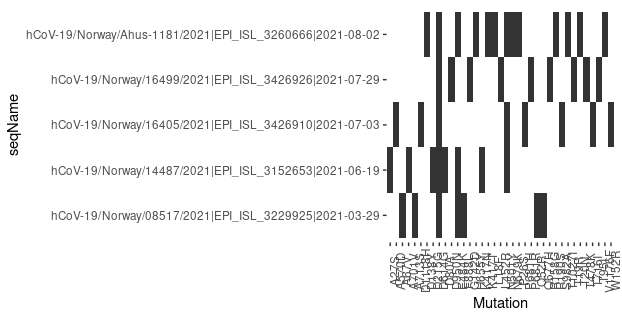
# Only Spike protein
nextclade %>%
  select(seqName, aaSubstitutions) %>%
  # Remove samples with no sequence (if any)
  drop_na() %>%
  mutate(tmp = str_split(aaSubstitutions, ",")) %>%
  unnest(tmp) %>%
  separate(tmp, into = c("Gene", "Mutation")) %>%
  select(-aaSubstitutions) %>%
  filter(Gene == "S") %>%
  ggplot(aes(x = Mutation, y = seqName)) +
  geom_tile() +
  theme(axis.text.x = element_text(angle = 90),
        panel.background = element_blank())
Leave a Comment