Plot coverage from bamfiles
Plot coverage from bamfiles
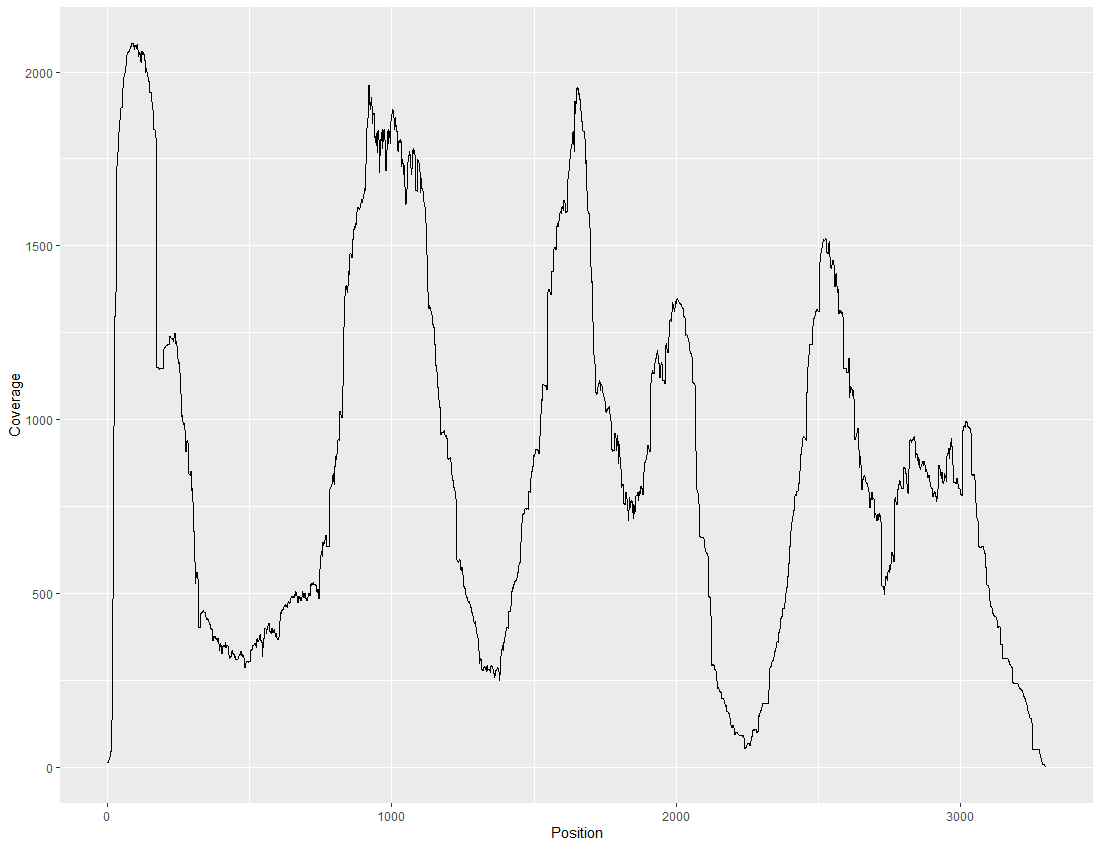
Using samtools depth and ggplot to plot the coverage of mapping from bamfiles. -aa option to include all nucleotides in reference, and -d to increase the maximum coverage depth.
# Using samtools v.1.3.1 in a Unix environment
# Setting max depth to 1000000 with -d (8000 default).
samtools depth -aa -d 1000000 input.bam | grep "contig_youwant_to_count" | gzip > coverage.txt.gz

# Enter R
library(tidyverse)

# Load data
cov <- read_tsv(file = "coverage.txt.gz", col_names = FALSE) %>% # read_tsv will automatically detect the file extension and unzip
  # There are no columns in the text file so they will be named X1, X2, etc.
  # We rename the columns for position in there reference and the coverage at that position
  rename("Position" = X2) %>%
  rename("Coverage" = X3)

# Create a simple line plot with default ggplot settings
cov %>% select(Position, Coverage) %>%
	ggplot(aes(Position, Coverage)) +
	geom_line()
Leave a Comment